
Stainless Steel 316 Price Chart 2026: Trend and Insights | IMARC Group
Global Stainless Steel (316) Prices Outlook – Q2 2026
SS 316 Price Index data for Q2 2026 indicates a moderate upward trend of approximately +3.1% quarter-on-quarter, supported by firm demand in construction, automotive, and industrial manufacturing sectors. Buyers tracking the Stainless Steel 316 Price Chart observed a widening price gap between high-cost Western markets and cost-efficient Asian producers.
The stainless steel (316) price trend during Q2 2026 was influenced by nickel and molybdenum feedstock costs, energy pricing, and regional supply-demand balances. According to IMARC Group’s Q2 2026 price-tracking database and methodology, stable downstream demand and controlled production levels helped sustain price growth despite global macroeconomic uncertainties.
Regional Stainless Steel (316) Price Outlook – Q2 2026 (USD/MT)
- USA: USD 5638/MT
- China: USD 2278/MT
- Germany: USD 2934/MT
- Canada: USD 5096/MT
- India: USD 2764/MT
The pricing spread highlights a significant gap between high-cost North American markets and lower-cost Asian producers. China’s competitive pricing reflects large-scale production and lower input costs, while the USA and Canada remain elevated due to strong domestic demand and higher operational expenses. Europe and India fall within a mid-range pricing structure.
Overall, regional performance in Q2 2026 reflected divergent cost structures and demand conditions. North America maintained high pricing supported by infrastructure and industrial demand, while Asia-Pacific markets benefited from cost efficiency and stable supply. Europe showed moderate pricing due to balanced demand and energy costs, and India remained competitive with steady domestic consumption and controlled imports.
Regional Stainless Steel (316) Price Analysis: Where Are Prices Rising or Falling?
North America (USA) – Strong Demand Keeping Prices Elevated
The United States recorded stainless steel (316) prices at USD 5638/MT, indicating a firm upward trend. Demand from construction, oil & gas, and heavy engineering sectors remained robust. Higher labor and energy costs contributed to elevated pricing, while limited import competition supported domestic producers.
Asia-Pacific (India, China) – Cost Advantage Driving Competitive Pricing
Asia-Pacific markets showed moderate to low pricing levels:
- China: USD 2278/MT
- India: USD 2764/MT
China remained the most cost-competitive market due to large-scale production capacity and lower raw material costs. India’s pricing reflected balanced domestic demand and steady infrastructure activity. Both markets experienced stable-to-slightly upward trends driven by improved industrial output.
Europe (Germany) – Balanced Market Conditions
Germany reported stainless steel (316) prices at USD 2934/MT, reflecting stable pricing conditions. Demand from automotive and industrial manufacturing sectors supported the market, while energy costs remained a key factor influencing production expenses.
North America (Canada) – Parallel Trend with the USA
Canada recorded prices at USD 5096/MT, slightly lower than the USA but still elevated. The market followed a similar trend, supported by strong industrial demand and higher production costs.
Supply And Demand Overview – Q2 2026
The stainless steel (316) market in Q2 2026 was characterized by steady demand and controlled supply. Key end-use industries such as construction, automotive, oil & gas, and chemical processing continued to drive consumption. Demand for corrosion-resistant materials supported the use of grade 316 stainless steel in critical applications.
On the supply side, production levels remained stable across major regions, with Asia maintaining its dominance due to cost efficiency and capacity scale. Raw material availability, particularly nickel and molybdenum, influenced production costs and pricing trends.
Trade flows played a significant role, with exports from Asia supplying global markets at competitive rates. Meanwhile, higher production costs in North America and Europe limited supply flexibility, contributing to elevated regional prices.
Stainless Steel (316) Price Index & Historical Analysis
The Stainless Steel (316) Price Index for Q2 2026 recorded a moderate increase compared to Q1 2026, reflecting improved demand conditions and stable raw material costs. The index movement indicates a gradual recovery from earlier volatility observed in previous quarters.
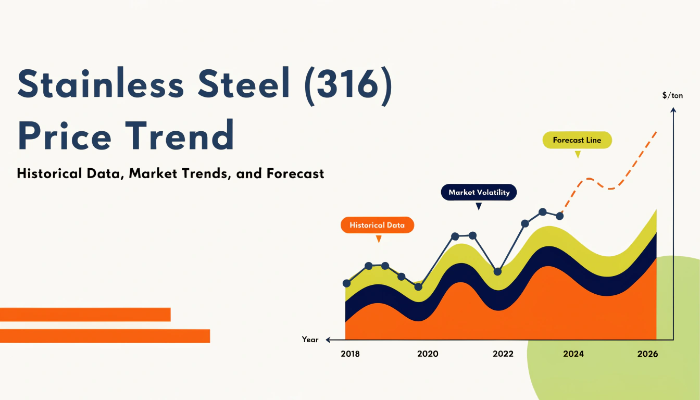
Historical analysis using the stainless steel (316) price history chart shows cyclical trends driven by fluctuations in nickel prices, energy costs, and global industrial activity. Compared to Q1 2026, Q2 demonstrated stronger price stability, particularly in North America and Europe.
Asia continued to exert downward pressure on global averages due to its lower production costs, creating a persistent pricing gap between regions.
Stainless Steel (316) Price Forecast 2026: What Should Buyers Expect Next?
The stainless steel (316) price forecast 2026 suggests a stable to slightly bullish outlook over the next 12 months. Demand from infrastructure projects, renewable energy, and industrial manufacturing is expected to remain strong, supporting price levels.
Raw material costs, particularly nickel and molybdenum, will remain key determinants of price direction. Any supply disruptions or price spikes in these inputs could lead to upward pressure on stainless steel prices.
Asia is expected to maintain its competitive pricing advantage, while North America and Europe may continue to experience higher price levels due to cost structures. Procurement strategies should focus on supplier diversification and long-term contracts to manage price volatility.
Key Factors Affecting Stainless Steel (316) Prices: Quarterly Perspective
Several factors influenced the stainless steel (316) price trend in Q2 2026:
- Raw Material Costs: Nickel and molybdenum prices played a critical role in determining production costs.
- Energy Prices: Electricity and fuel costs impacted manufacturing expenses, especially in Western markets.
- Industrial Demand: Growth in construction, automotive, and oil & gas sectors supported demand.
- Trade Policies: Import/export regulations influenced global supply chains and pricing dynamics.
- Capacity Utilization: Production levels in major exporting countries affected global availability.
These factors collectively shaped regional price variations and overall market trends.
What Is Stainless Steel (316)?
Stainless steel (316) is an austenitic stainless steel grade known for its superior corrosion resistance, particularly in chloride environments. It contains higher levels of molybdenum compared to grade 304, making it suitable for marine, chemical, and industrial applications.
Widely used in construction, medical equipment, food processing, and offshore industries, stainless steel (316) offers durability, strength, and resistance to harsh environments. Its demand is closely linked to industrial activity and infrastructure development.
Recent Developments (Q2 Highlights)
- Stable production levels across major global manufacturers supported market balance.
- Strong demand from infrastructure and energy sectors sustained price growth.
- Asia continued to dominate exports due to cost efficiency and capacity scale.
- Raw material prices remained relatively stable, limiting extreme price volatility.
- Trade flows remained active, with competitive pricing from Asian suppliers influencing global markets.
Get the Latest Price Data – Request Your Sample Report: https://www.imarcgroup.com/stainless-steel-316-price-trend/requestsample
FAQs About Stainless Steel (316) Price Index & Market Analysis:
What Is the Current Stainless Steel (316) Price Index in 2026?
The Stainless Steel (316) Price Index in Q2 2026 showed a moderate increase compared to Q1, driven by steady demand and stable supply conditions. Regional price variations remain significant, particularly between Asia and North America.
How Does the Stainless Steel (316) Price Chart Help Buyers?
The Stainless Steel (316) Price Chart provides insights into historical and current price movements across regions. It helps procurement managers identify cost trends, compare markets, and make informed purchasing decisions.
What Is the Stainless Steel (316) Price Forecast for 2026?
The Stainless Steel (316) Price Forecast for 2026 indicates stable to slightly rising prices supported by industrial demand. Raw material costs and regional supply conditions will remain key factors influencing future price trends.
Conclusion
Stainless steel (316) prices in Q2 2026 showed a steady upward trend supported by strong industrial demand and stable supply conditions. Regional disparities remained significant, with Asia offering cost advantages and North America maintaining higher price levels.
Looking ahead, prices are expected to remain stable with a slight upward bias, driven by infrastructure growth and raw material trends. Strategic sourcing and supplier diversification will be essential for managing cost fluctuations effectively.
Contact Us:
IMARC Group
134 N 4th St., Brooklyn, NY 11249, USA
Email: sales[@]imarcgroup.com
Tel No:(D) +91 120 433 0800
United States: +1-201971-6302








0 Comments